LandSat Image
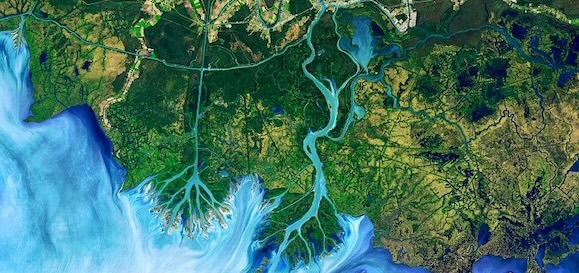
Feature image from LandSat. Image credit: Joshua Stevens/NASA Earth Observatory
List of experiences
Request Process and Form
Faculty Developer and Host: Dr. Xiaojing Tang, Geography

Dr. Tang photo

Spring semester availability

Feb 12- March 6 and March 27-April 10, not available April 5th

Mondays and Wednesdays, 9-11; Fridays 9-11 and 11:30-1:30


Description
Have you ever seen one of those Internet photos in which the same people take pictures at the same place decades apart? It is always stunning how much time can change everything. Do you know we can do the same with our Earth? NASA satellite programs have been continuously collecting images of the Earth’s surface for more than 50 years. The data is free and there’re a ton of open-source tools that we can use to analyze the images. In this session, we will explore the changes to the Earth’s surface (deforestation, urbanization, mining, etc.) using satellite imagery and Google Earth Engine. The students will have the opportunity to choose a type of land change that they are interested in and map the change using a set of user-friendly tools designed specifically for middle/high school students. Through this session, students will observe the transformation of the landscape, identify objects in satellite images, understand image processing techniques, and create maps of land changes. 
To Share with Your Students Before the Visit
Overview of What your Students will be Doing
  • Start with a brief introduction to remote sensing and satellite imagery
  • A fun exercise of guessing where the images are taken and what is in the images
  • Observe how humans have transformed the landscape using Google Earth Engine Time-lapse
  • Split into groups and work on mapping specific types of changes
  • Assess the accuracy of the maps
  • Presentation of the results
  • Closing remarks 
Differentiation
For middle school students, we will spend more time observing and visually interpreting the changes in the satellite images. They will rely on simpler threshold-based methods for mapping the land changes.  They will only visually assess the quality of their maps. For high school students, we will spend more time on the analysis. They will run image classification to create maps of land changes. They will also conduct a statistic-based accuracy assessment. 
Helpful Background Knowledge
  • Experience looking at satellite images on Google Earth/Map
  • Familiar with geography, natural resources, and human development
  • Entry-level training in GIS would be great, but not required 
Transferable STEM Skills Practiced

Quantitative reasoning: Students will use accuracy assessment to quantify the accuracy of their maps. 

Data interpretation/analysis: Students will practice visual interpretation of satellite images, and perform image processing and classification on the images.

Data visualizationStudents will visualize the satellite images and the change maps they made

Scientific communicationStudents will be asked to present their results.

Cross-Disciplinary Connections
Both environmental and earth sciences use remote sensing (or satellite imagery) to study and monitor the changes and characteristics of the Earth’s surface. The maps/information produced by remote sensing applications are frequently used by biologists to understand plant physiology and animal habitats. The way the satellite collects imagery involves physics. Certain part of the analysis, such as the accuracy assessment and image classification is based on statistics and probability.
Connections to Dr. Tang's Teaching and Research Interests
Most of my research, funded by NASA, USGS, and DoD involves the detection and monitoring of changes to the Earth’s surface and understanding the impact of those changes. I teach intro and advanced-level remote sensing at JMU which is based upon what we are going to do in this workshop. I also run workshops and training in developing countries using the very same Google Earth Engine to help them build the capacity of using NASA assets to better manage their land and resource. 
Examples of Connections to Solving Real-World Challenges
Forest covers approximately 30% of land area. Deforestation is a large source of anthropogenic carbon emissions, and it also negatively impacts biodiversity, food security, and human livelihood. UN FAO estimates that the rate of deforestation was 10 million hectares per year between 2015 and 2020. The most efficient way to map and monitor deforestation activities is the use of satellite images and remote sensing techniques. One of the most widely used data products, the Global Forest Change is produced using the same Landsat imagery and the same Google Earth Engine tool that we will use in this workshop. 
Related Careers

Remote sensing scientist applies remote sensing principles and methods to solve real-world problems such as resource management, urban planning, climate modeling, and ecological forecasting.

Geospatial Intelligence Analysis uses aerial, satellite, and drone imagery to extract and collect intelligence critical to our national security.

Extra Background Information for Teachers

Back to Top