Assign weights to the final list of variables
Once the final variable set is chosen, PAIR will help you assign weight values to variables based on their importance in considering a peer group. For example, if you felt that it would be more important for a peer group to be similar to JMU in graduation rates than the size of its student body, you might assign a value of 20 (indicating 20%) to the graduation rate variable and only 10 to the enrollment size. The total value of the assigned weights should equal roughly 100 across all variables. It is also possible to not assign any weight values if you view each variable to be of equal importance.
Action Item: Involve constituents to assign weights (optional).
We recommend following these steps to determine the final weights, if desired:
- Create a list of the final continuous variables that will be considered. You do not need to weight the categorical (i.e., filtering) variables.
- Request that the same constituents that provided input on the selection of variables now “assign” values to the variables to indicate the importance of each variable towards the development of the peer group.
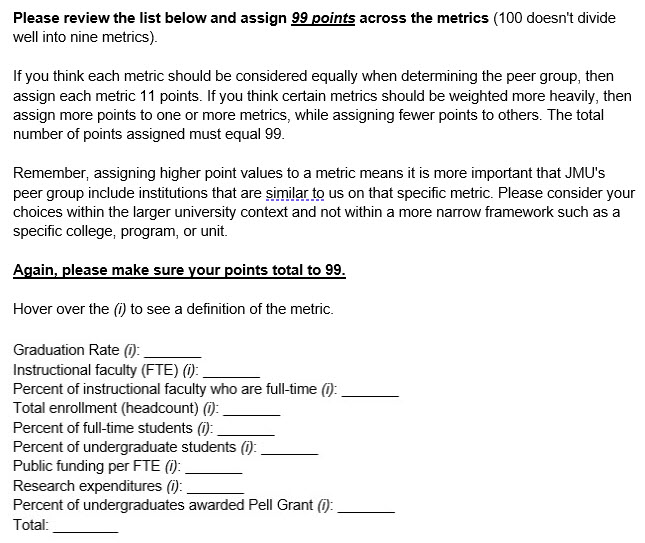
This step can be done in person during a meeting or retreat. If there is not an opportunity to get this feedback in person, or if the number of people from which you are seeking feedback is too broad, this step can be accomplished in a one question survey. (see snapshot)
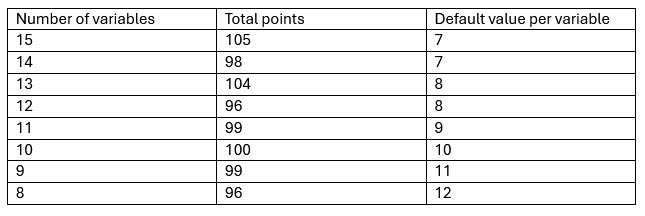
- Divide the total number of variables into 100. This number is the default value assigned to a variable that should not be considered more important than another. If the number of variables you have is different than ten, consider adjusting the total number of points so that the default value is a whole number. See chart below for recommendations:

- Ask constituents to assign values to each variable so that the total number of points assigned is equivalent to the “Total Points” column in the table above. If the respondent does not believe any variable should be weighted more heavily in the analysis, then they should assign the appropriate “default value per variable” to each variable. Variables that receive more points indicate characteristics that are more important. As an example, if a respondent believes that it is more important for a JMU peer to have similar research expenditures than enrollment size, they would assign more points to a “research expenditures” variable and fewer points to a “total enrollment.” In essence, what this decision indicates is that if an institution was the same size as JMU but had drastically different research expenditures, we would be less likely to count them as a peer than an institution with similar research expenditures but that was drastically smaller or larger than JMU.
- Divide the total number of variables into 100. This number is the default value assigned to a variable that should not be considered more important than another. If the number of variables you have is different than ten, consider adjusting the total number of points so that the default value is a whole number. See chart below for recommendations:
- After you have received the scores assigned from each individual constituent, the final step is to average the scores for each variable to come up with a final variable weight.
As an example, see the table below for values associated with three variables. Here, the total score was 30.
In this example, you can see that for each respondent, the total points assigned across the three values all equal 30. Respondent 1 felt that Variable 2 should receive more consideration in the formation of a peer group than either Variable 1 or Variable 3. Respondent 3 felt that each variable should receive equal treatment. As a group, the average score for Variable 1 was 11.4, Variable 2 was 10.6, and Variable 3 was eight. Thus, overall, Variable 1 was considered the most important characteristic to consider when choosing peers. Although everyone had slightly different considerations, the average weight provides a way to quantify the weights without the more difficult task of reaching consensus among the entire group.
Note that this approach also allows certain weights to be removed as outliers if they are drastically different from most of those assigned. Respondent 5 assigned a very high weight to Variable 1. When calculating the average, this type of lopsided assignment has the potential to skew the average for a particular variable, possibly assigning it a weight that is more heavily influenced by a single respondent. PAIR can work with you to help identify whether these anomalies exist and to consider whether to remove them before doing the analysis. Removal should be done sparingly, though, as there should not be an attempt to influence the results without just cause.
