
Create final list of peers
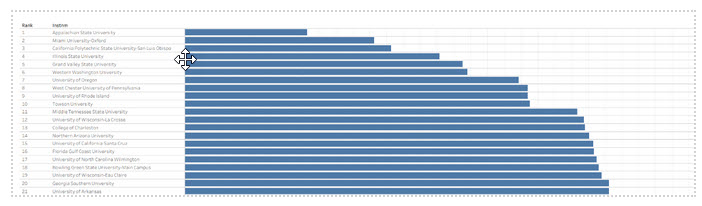
Once the population of institutions is sorted in ascending order by distance (smaller distances indicate greater similarity to JMU), PAIR will provide a bar graph that clearly illustrates the total pairwise distance between JMU and each institution in the final population. PAIR will then recommend the number of institutions to be included in the final peer group based on peer group requirements and the general breakdown of distance scores for each institution. Ideally, the peer group will include the Top 10- 20 institutions.
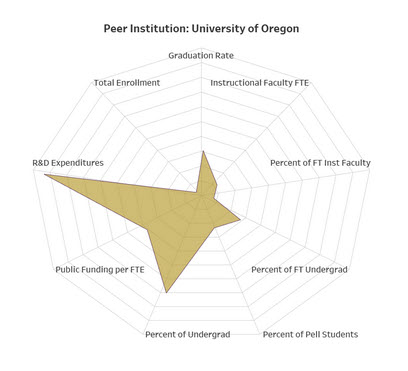
At this point, you may wish to share this list with any constituent groups that are intimately involved with the use of the peer group. A common occurrence at this stage is to “swap” institutions, replacing institutions with small distances with those farther down the list. This may occur if a constituent has a specific awareness of a school that they consider “to be like JMU.” Further, an institution may not seem like a good fit on the surface. We can visualize the distances of a peer institution from JMU on a specific variable using a radar plot. This visualization helps decision-makers view the “distance” between a comparison school and JMU on each variable to better understand the ways in which the comparison school was most similar and dissimilar to JMU.
To see how a radar plot can be used to understand why a particular institution was included, consider the following example. When the JMU task force was developing a characteristically similar peer group to JMU, members questioned the appearance of an R1 institution on the list (highest research). While JMU was dissimilar from this institution on the “research expenditures” variable, it was very similar to it on several of the other variables used in the analysis. The radar plot shown below illustrates this point. Thus, anyone reviewing the final list must understand that the peers are established based on the combination of ALL the variables included in the analysis.
If done well, the process to involve constituents in the selection of the variables and weights produces a peer group that meets the specific needs of the study. This process also avoids “swapping” based on individual preferences or the perceived lack of face validity (i.e., this institution cannot be a peer because it doesn’t look like us). For that reason, PAIR does not recommend “swapping” as a common practice. Any challenges to the top members of the peer group should cause questions about whether the variables or weights were chosen correctly, in which case, the group should return to Step 4 in the process.