
Reports provide a snapshot in time according to the date you enter when you create or run the report. Reports give you the ability to view data related to multiple objects.
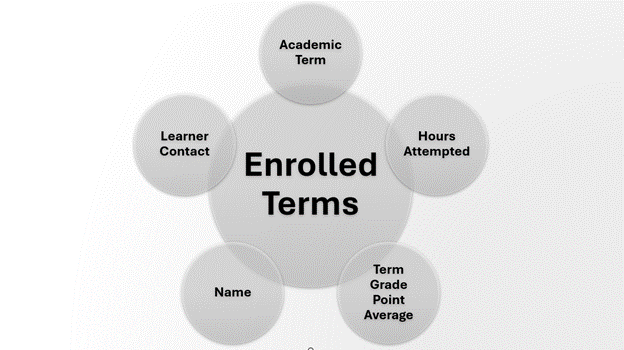
What is an object? In the CRM, an object represents a set of fields. For example, objects on the Student Account screen include Enrolled Terms, Enrolled Courses, Cases, etc.
Below is an example of an object ("Enrolled Terms") on the Student Account and its related fields.
You can filter, group, and do math on records accessed through a report. You can also display results graphically in a chart.
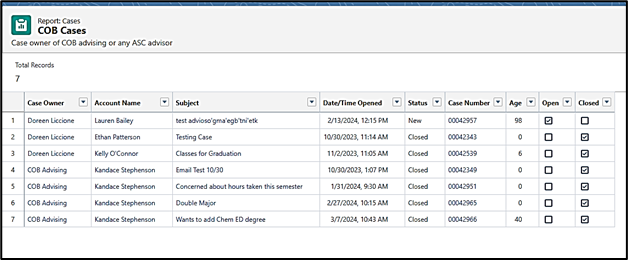
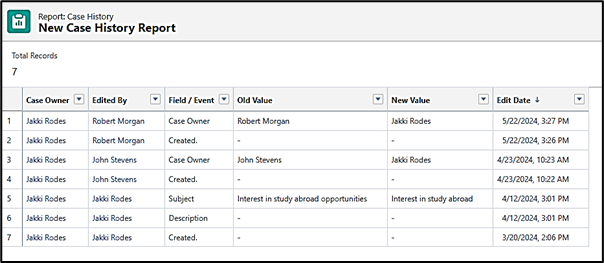
Below is an example of a report.
Reports are stored in folders, which determine who has access to view, edit, or manage the reports stored within them.
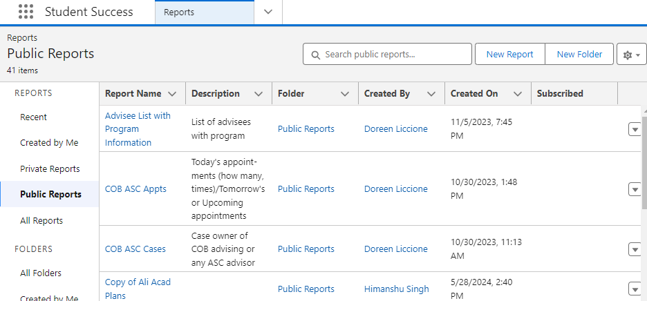
View & Copy Existing Reports
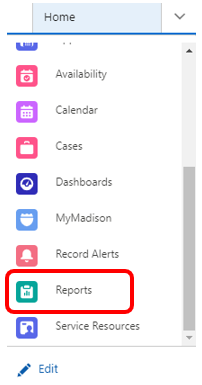
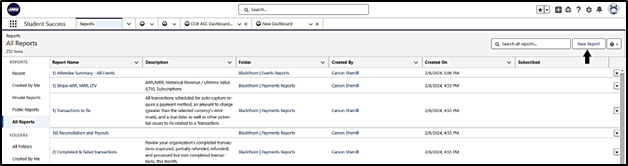
- Select Reports from the Navigation Drop-down menu.
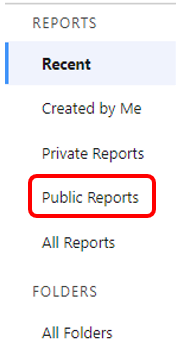
- Reports are shared on a folder level. On the left side of the screen, click Public Reports to find existing reports that are available to run and/or to save as your own and customize.
- Select the report you wish to access. You can run the report as-is or make a copy and edit it.
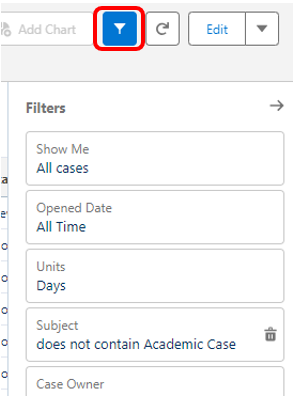
- Once you select the report, you will see a list of records. You can use the filter option to manipulate any data that you see on the list.
- If you want to change the fields and filters of a report, you will need to create a copy of the report by selecting the arrow beside edit and then select Save As.
It is important to use "Save As" whenever you change a report! If you click "Save" instead, you will change the report for EVERY user who uses the same report.
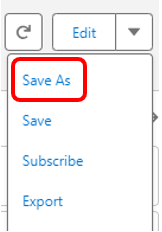
Using the Save As feature allows you to use the existing framework to create your own report. When using Save As:
- The suggested naming convention for reports is: Business Object by Filter (Creator of report). For example: Cases by Status (Jakki Rodes)
- If the report is just for your personal use, it is recommended to save it to your Private Reports folder.
- If the report will be useful to other people, you can save it to the Public Reports folder.
Create a New Report
As a CRM user, you can create reports from scratch. Before creating a new report, though, it is strongly recommended that you check to see if an existing public report already meets your needs, as you can easily run it as-is or use "Save As" to copy and customize it.
Report Formats
When creating a report, there are three report formats to choose from.
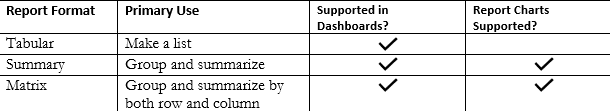
Tabular reports are the simplest and fastest way to look at your data. This type of report is similar to a basic spreadsheet.
Summary reports are similar to tabular reports, but they also let you group rows of data, view subtotals, and create charts. This type of report is good for dashboards.
Matrix reports let you group results both by rows and by columns. They take the longest to set up, but they provide the most detailed view of your data. They are helpful to set up for at-a-glance overviews of data.
- To start creating a new report, from the main reports screen, select New Report.
- Under the Category header on the left side of the screen, click All. Choose a report type to base your report on. A report type is basically a template, and it determines the records and fields that will be available for your report.
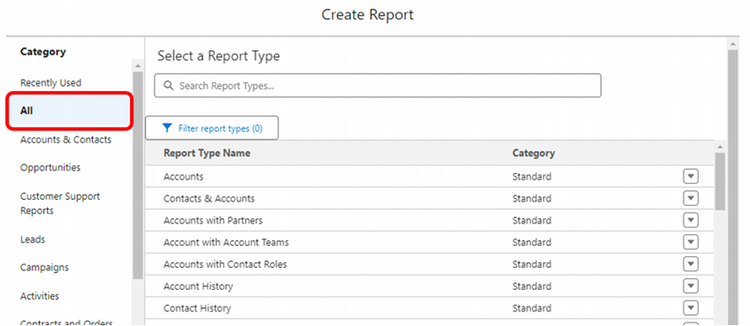
- After you select your report type, you will be able to create your own report. Please note there are limitations in each data set regarding which business objects can be linked (they may not have a common field that would link them together). If you click Fields, you can make sure the report has the fields you’re looking for.
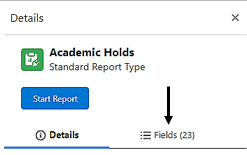
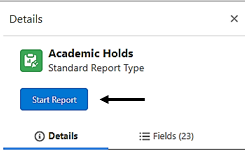
- Click Start Report.
Key Elements in the Report Builder
Once you click Start Report, you are taken to the Report Builder screen. Settings will display on the left, while a report preview will show to the right.
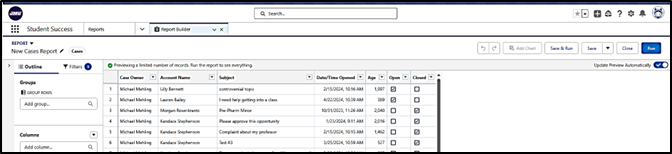
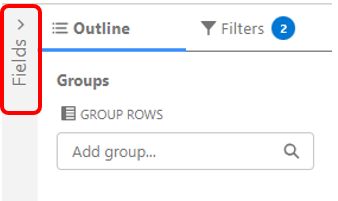
The Fields panel on the left displays a list of all the fields you can add to your report; the fields available depend on the report type selected. If you click the carrot next to the term “Fields” you will see the list.
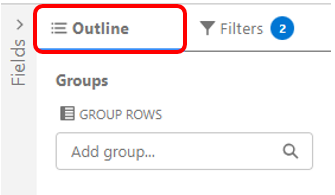
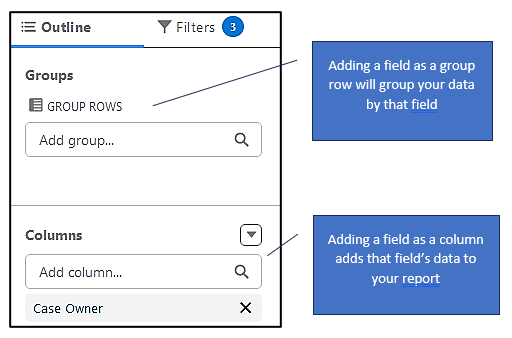
The Outline tab is where you will build your report by selecting the fields to display. You can group the information you choose to display by rows (summary report) or rows and columns (matrix report).
You can add fields by using the search feature (especially when you are familiar with the fields available in the report type you selected), or simply clicking and dragging them from the Field pane over to the group or column section.
You can remove fields by clicking the “x” next to the field name.
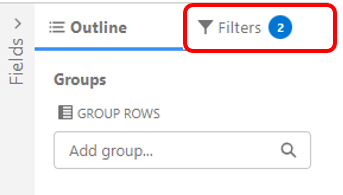
The Filters tab lets you apply standard filters; adding filters can be helpful when you want to limit the results in your report.
The number to the right of the tab name shows the number of filtering restrictions currently applied to the report. The report type determined the initial scope of the report, but this can be manipulated by changing and adding filters.
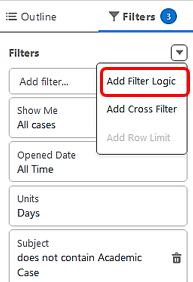
You can add up to 20 filters to a report by using the Add filter field. You can also use filter logic such as “and,” “or,” and “not.”
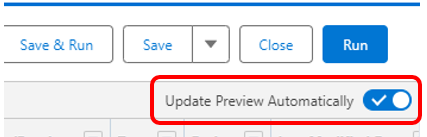
In the upper right of the preview, enable the Update Preview Automatically toggle to see a preview of the report details real-time as you build the report.
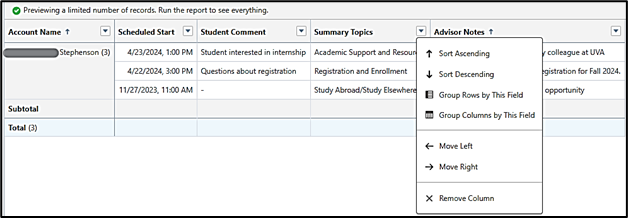
In the Preview pane, you can add, reorder, and remove columns, summary fields, formulas and groupings. You also can click and drag columns and rows in the preview pane to change the order in which information displays. Note: the preview displays a limited number of records, so you need to run the report to see all of your results.
Apply Report Filters & Work with the Outline
- A default filter is applied to your report and cannot be deleted, but you can modify the variables for that filter if you desire. Note: You will only see conditions such as “equals” or “less than” when you add a manual filter.
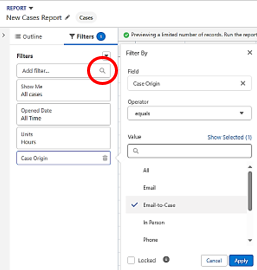
- To add another filter, click the magnifying glass in the Add filter field and select the filter and any related filter logic you wish to use. Then click Apply. You can have fields reflected as columns in your report and utilized as filters. In the following example, the filter “Case Origin” with the value equal to “Email-to-case” has been added.
- If you add multiple filters, you can apply filter logic to further refine which results will display.
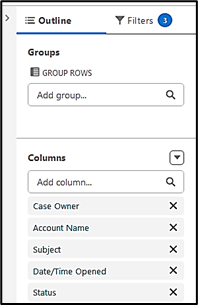
- Click the Outline tab. The field options available in “Add group” and “Add column” are determined by the report type you originally selected. Add as many fields as you wish by searching for and selecting the field name or by simply clicking and dragging the field name from the list to the row or column you want to display it in.
- You can also easily remove columns by clicking the X next to the field name.
Note: As you make changes, keep an eye on the Preview pane to see if the results you want are displaying.
- Once you have added the fields and filters you wish to apply, click Save & Run.
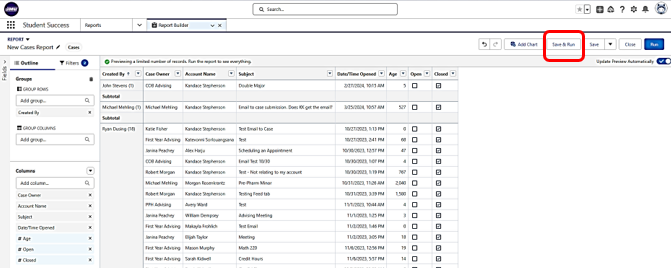
- Name your report, select the folder you want to save it in, and click Save. If the report would benefit others in your department, save it in a departmental folder. Otherwise, you can save it in your private folder.
